More
Choose


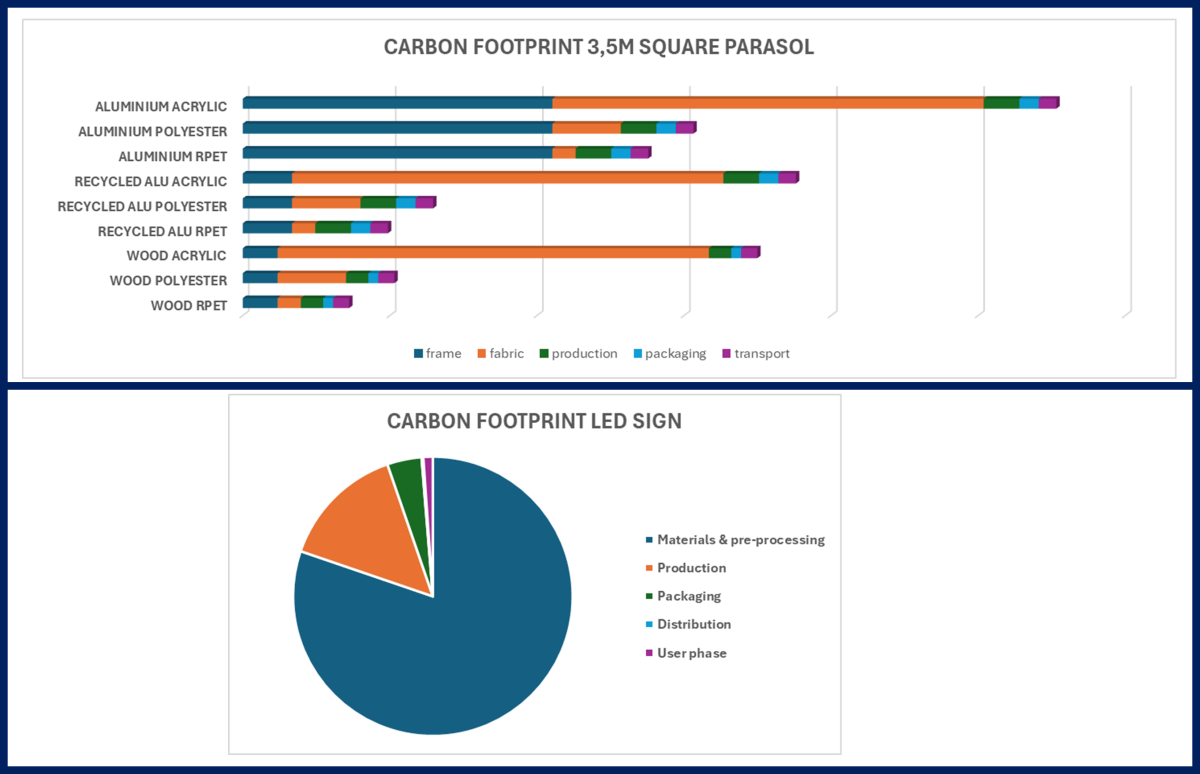
Focusing on the reduction of the footprint of our parasols and signs, we assessed the figures as shown in the graphs. These figures clearly indicate that raw materials (blue and orange forthe parasols and blue for the signs) dominate the footprint.
There is a widespread perception that transportation significantly contributes to a product’s carbon footprint. However, the data below shows that raw materials account for a much larger share of emissions, while the impact of transport is relatively small. Producing closer to the market has a positive effect, but its influence is often overstated compared to the impact of raw material sourcing.
Back to overview